Information may be obtained or stored in your browser by cookies when you access the Website. This information is related to the user, the user settings or device. It is primarily used to ensure the site functions as expected by the user. We respect your right to privacy. Therefore, you can select to not allow some types of cookie. Please click on the different category headings to check the details and then change our default settings.
Strictly Necessary Cookies are cookies that are essential for this site to function properly. Strictly Necessary Cookies do not store information that can identify individuals. Strictly Necessary Cookies are used to view this site. Therefore, you cannot refuse the use of Strictly Necessary Cookies from these cookie settings. However, you can refuse the use of Strictly Necessary Cookies from the settings of your browser at any time. Please note that parts of the site may not function if you refuse the use of Strictly Necessary Cookies.
This site uses the following Strictly Necessary Cookies.
Cookie name: gdprCookieEn
Cookie name: optGA
Cookie name: optPardot
Indicators | Covering | Unit | 2020 | 2021 | 2022 | 2023 | 2024 |
---|---|---|---|---|---|---|---|
Principal raw materials | non-consolidated | tons | 36,614 | 47,583 | 44,211 | 40,707 | 42,073 |
Auxiliary materials | non-consolidated | tons | 16,581 | 18,529 | 17,026 | 12,512 | 16,189 |
Plastic packaging materials | non-consolidated | tons | 194 | 266 | 389 | 180 | 299 |
Cardboard packaging materials | non-consolidated | tons | 415 | 529 | 480 | 395 | 432 |
Other packaging materials | non-consolidated | tons | 461 | 489 | 470 | 434 | 413 |
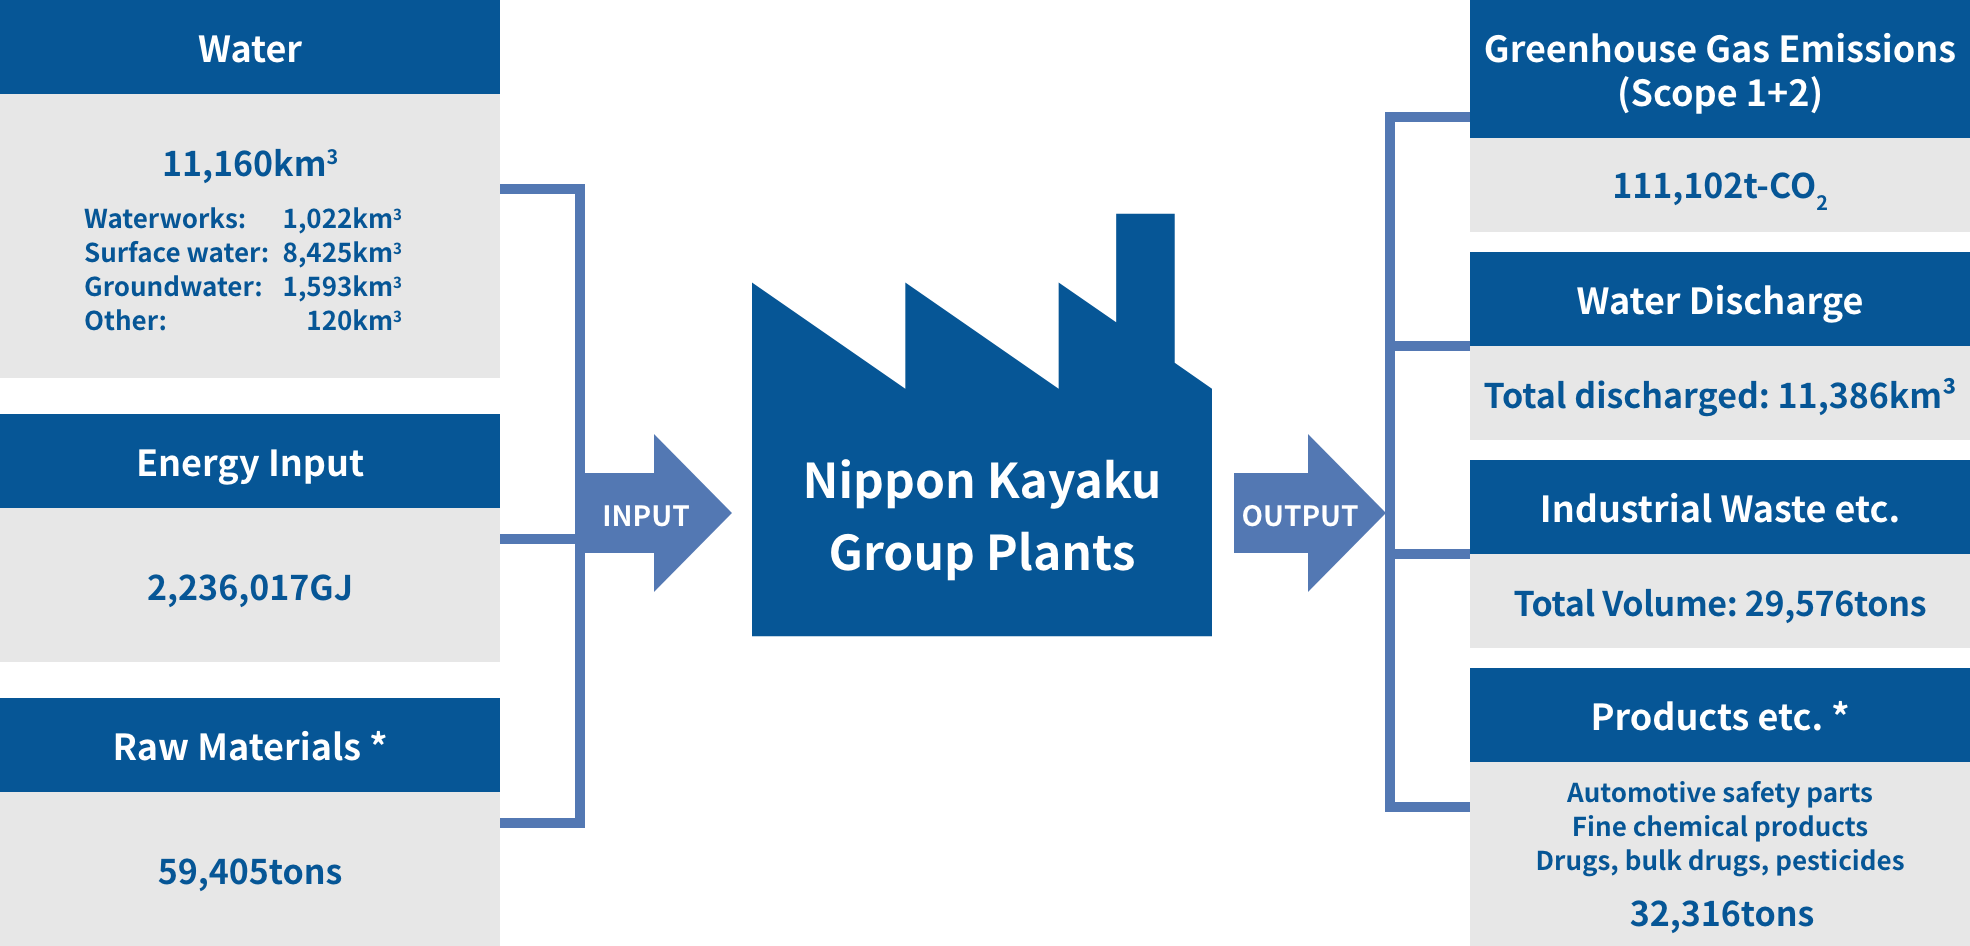
Total | non-consolidated | tons | 54,266 | 67,396 | 62,576 | 54,227 | 59,405 |
Indicators | Covering | Unit | 2020 | 2021 | 2022 | 2023 | 2024 |
---|---|---|---|---|---|---|---|
Amount of energy input (heat quantity equivalent) | consolidated | GJ | - | - | - | 2,062,745 | 2,236,017 |
Renewable energy | consolidated | GJ | - | - | - | 29,060 | 37,035 |
Non-renewable energy sources | consolidated | GJ | - | - | - | 2,033,685 | 2,198,982 |
Indicators | Covering | Unit | 2020 | 2021 | 2022 | 2023 | 2024 |
---|---|---|---|---|---|---|---|
Energy-derived CO2 | consolidated | t-CO2e | 114,281 | 108,410 | 103,811 | 99,124 | 107,248 |
Non-energy-derived CO2 | consolidated | t-CO2e | 2,771 | 3,230 | 2,745 | 2,463 | 2,023 |
N2O | consolidated | t-CO2e | 123 | 112 | 169 | 339 | 449 |
CH4 | consolidated | t-CO2e | 26 | 29 | 30 | 34 | 34 |
HFCs | consolidated | t-CO2e | 16 | 7 | 138 | 113 | 19 |
Other CFCs | consolidated | t-CO2e | 1,011 | 794 | 1,409 | 632 | 1,330 |
PFCs | consolidated | t-CO2e | 0 | 0 | 0 | 0 | 0 |
SF6 | consolidated | t-CO2e | 0 | 0 | 0 | 0 | 0 |
NF3 | consolidated | t-CO2e | 0 | 0 | 0 | 0 | 0 |
Total*1 | consolidated | t-CO2e | 118,227 | 112,584 | 108,301 | 102,705 | 111,102 |
Scope1 | consolidated | t-CO2e | 35,613 | 37,819 | 35,581 | 30,158 | 32,521 |
Scope2 (Market base) | consolidated | t-CO2e | 82,615 | 74,765 | 72,720 | 72,546 | 78,581 |
Emission volume per unit of sales*2 | consolidated | 0.68 | 0.61 | 0.55 | 0.51 | 0.5 |
Indicators | Covering | Unit | 2020 | 2021 | 2022 | 2023 | 2024 |
---|---|---|---|---|---|---|---|
Energy-derived CO2 | non-consolidated | t-CO2e | 71,632 | 63,168 | 62,267 | 57,748 | 63,228 |
Non-energy-derived CO2 | non-consolidated | t-CO2e | 2,733 | 3,189 | 2,719 | 2,406 | 1,984 |
N2O | non-consolidated | t-CO2e | 123 | 112 | 169 | 339 | 449 |
CH4 | non-consolidated | t-CO2e | 26 | 29 | 30 | 34 | 34 |
HFCs | non-consolidated | t-CO2e | 12 | 3 | 110 | 49 | 0 |
Other CFCs | non-consolidated | t-CO2e | 34 | 336 | 622 | 70 | 70 |
PFCs | non-consolidated | t-CO2e | 0 | 0 | 0 | 0 | 0 |
SF6 | non-consolidated | t-CO2e | 0 | 0 | 0 | 0 | 0 |
NF3 | non-consolidated | t-CO2e | 0 | 0 | 0 | 0 | 0 |
Total*1 | non-consolidated | t-CO2e | 74,559 | 66,839 | 65,916 | 60,647 | 65,765 |
Category | Covering | Unit | 2020 | 2021 | 2022 | 2023 | 2024 | |
---|---|---|---|---|---|---|---|---|
1 | Products and services purchased | consolidated | t-CO2e | 237,300 | 294,500 | 275,000 | 241,800 | 259,600 |
2 | Capital goods | consolidated | t-CO2e | 42,900 | 26,800 | 29,600 | 33,400 | 55,900 |
3 | Fuels and energy-related activities not included in Scope 1 and 2 | consolidated | t-CO2e | 21,200 | 22,300 | 21,000 | 20,500 | 22,700 |
4 | Exports and distribution (upstream) | consolidated | t-CO2e | 17,600 | 22,300 | 19,700 | 16,600 | 18,000 |
5 | Business waste produced | consolidated | t-CO2e | 28,800 | 31,800 | 16,200 | 10,800 | 14,700 |
6 | Business trips | consolidated | t-CO2e | 800 | 800 | 800 | 800 | 800 |
7 | Employee commutes | consolidated | t-CO2e | 2,400 | 2,400 | 2,400 | 2,400 | 2,500 |
8 | Leased assets (upstream) | consolidated | t-CO2e | Included in Scope 1, 2, therefore not separately calculated | ||||
9 | Exports and deliveries (downstream) | consolidated | t-CO2e | 1,000 | 1,600 | 1,500 | 1,200 | 1,400 |
10/11 | Processing of sold goods andUse of sold goods | consolidated | t-CO2e | - | - | - | - | - |
12 | Disposal of sold goods | consolidated | t-CO2e | 23,200 | 26,400 | 23,000 | 17,600 | 17,300 |
13 | Leased assets (downstream) | consolidated | t-CO2e | 400 | 400 | 400 | 400 | 400 |
14/15 | Franchise and Investments | consolidated | t-CO2e | - | - | - | - | - |
Total*1 | consolidated | t-CO2e | 375,600 | 429,300 | 389,600 | 345,000 | 393,300 |
Indicators | Covering | Unit | 2020 | 2021 | 2022 | 2023 | 2024 |
---|---|---|---|---|---|---|---|
Production, R&D and office departments | non-consolidated | 1,000kL | 38,700 | 40,325 | 38,583 | 32,634 | 35,646 |
Indicators | Covering | Unit | 2020 | 2021 | 2022 | 2023 | 2024 |
---|---|---|---|---|---|---|---|
Non-renewable fuels purchased and consumed (A) (Nuclear energy, coal, oil, natural gas etc.) |
non-consolidated | MWh | 155,201 | 165,494 | 153,390 | 137,447 | 149,994 |
Non-renewable electricity purchased (B) | non-consolidated | MWh | 95,819 | 98,505 | 95,837 | 85,946 | 93,436 |
Non-renewable energy purchased (steam, heat, cooling, and others) (C) | non-consolidated | MWh | 3,452 | 3,433 | 4,073 | 5,685 | 5,340 |
Renewable energy purchased and created (D) (Wind power, solar power, biomass, hydro-power, geothermal energy etc.) |
non-consolidated | MWh | 59 | 57 | 162 | 2,028 | 3,163 |
Non-renewable energy sold (E) (electricity, thermal, cooling) |
non-consolidated | MWh | 0 | 0 | 0 | 0 | 413 |
Total non-renewable energy used (A+B+C-E)* |
non-consolidated | MWh | 254,472 | 267,432 | 253,300 | 229,078 | 248,357 |
Indicators | Covering | Unit | 2020 | 2021 | 2022 | 2023 | 2024 | |
---|---|---|---|---|---|---|---|---|
Non-hazardous waste | non-consolidated | tons | 19,411 | 22,069 | 21,154 | 16,146 | 22,387 | |
Group companies | tons | 996 | 1,199 | 1,242 | 1,087 | 1,271 | ||
Total | tons | 20,407 | 23,268 | 22,396 | 17,233 | 23,658 | ||
General waste | non-consolidated | tons | 643 | 673 | 648 | 464 | 410 | |
Group companies | tons | 504 | 449 | 559 | 513 | 571 | ||
Total | tons | 1,147 | 1,122 | 1,207 | 977 | 981 | ||
Industrial waste | non-consolidated | tons | 18,768 | 21,396 | 20,506 | 15,682 | 21,977 | |
Group companies | tons | 493 | 750 | 682 | 574 | 700 | ||
Total | tons | 19,261 | 22,146 | 21,188 | 16,256 | 22,677 | ||
Hazardous waste | non-consolidated | tons | 5,925 | 6,503 | 6,467 | 4,828 | 5,838 | |
Group companies | tons | 92 | 86 | 71 | 59 | 80 | ||
Total | tons | 6,017 | 6,589 | 6,538 | 4,887 | 5,918 | ||
Source-specific hazardous industrial waste | non-consolidated | tons | 221 | 146 | 182 | 182 | 355 | |
Group companies | tons | 0 | 0 | 0 | 0 | 0 | ||
Total | tons | 221 | 146 | 182 | 182 | 355 | ||
Total*1 | tons | 26,426 | 29,857 | 28,934 | 22,119 | 29,576 | ||
Types of waste | Sludge | non-consolidated | tons | 1,979 | 2,309 | 2,338 | 2,291 | 2,100 |
Group companies | tons | 131 | 336 | 258 | 115 | 286 | ||
Total | tons | 2,110 | 2,645 | 2,596 | 2,406 | 2,386 | ||
Waste oil | non-consolidated | tons | 5,766 | 6,386 | 5,848 | 4,809 | 4,563 | |
Group companies | tons | 94 | 87 | 71 | 59 | 72 | ||
Total | tons | 5,860 | 6,473 | 5,919 | 4,868 | 4,635 | ||
Spent acid | non-consolidated | tons | 2,244 | 2,185 | 1,523 | 1,116 | 1,321 | |
Group companies | tons | 3 | 2 | 8 | 13 | 18 | ||
Total | tons | 2,247 | 2,187 | 1,531 | 1,129 | 1,339 | ||
Waste alkali | non-consolidated | tons | 13,382 | 15,784 | 16,064 | 11,219 | 17,717 | |
Group companies | tons | 17 | 11 | 11 | 8 | 9 | ||
Total | tons | 13,399 | 15,795 | 16,075 | 11,227 | 17,726 | ||
Plastic waste | non-consolidated | tons | 954 | 888 | 885 | 788 | 780 | |
Group companies | tons | 235 | 277 | 326 | 326 | 294 | ||
Total | tons | 1,189 | 1,165 | 1,211 | 1,114 | 1,074 | ||
Others | non-consolidated | tons | 1,010 | 1,021 | 962 | 751 | 1,744 | |
Group companies | tons | 609 | 572 | 640 | 624 | 672 | ||
Total | tons | 1,619 | 1,593 | 1,602 | 1,375 | 2,416 | ||
Landfill amount | non-consolidated | tons | 404 | 298 | 233 | 144 | 170 | |
Recycling rates*2 | non-consolidated | % | 81 | 82 | 87 | 84 | 87 | |
Zero-emissions rates | non-consolidated | % | 1.6 | 1 | 0.8 | 0.7 | 0.6 |
Indicators | Covering | Unit | 2020 | 2021 | 2022 | 2023 | 2024*2 | |
---|---|---|---|---|---|---|---|---|
PRTR substance emission amounts | Air | non-consolidated | tons | 16.8 | 25.2 | 38.7 | 32.9 | 27.2 |
Water regions | non-consolidated | tons | 9.1 | 14.7 | 51.4 | 75.0 | 1.6 | |
Soil | non-consolidated | tons | 0 | 0 | 0 | 0 | 0 | |
Total*1 | non-consolidated | tons | 25.9 | 39.9 | 90.1 | 107.9 | 28.8 |
Indicators | Covering | Unit | 2020 | 2021 | 2022 | 2023 | 2024 |
---|---|---|---|---|---|---|---|
Volatile Organic Compounds (VOC) | non-consolidated | tons | 33.3 | 52.1 | 38.7 | 32.9 | 60.3 |
Dichloromethane | non-consolidated | tons | 4.0 | 3.6 | 3.2 | 2.7 | 4.9 |
Formaldehyde | non-consolidated | tons | 0.04 | 0.15 | 0.13 | 0.13 | 0.04 |
NOx*1 | non-consolidated | tons | 7.5 | 7.7 | 8.3 | 6.7 | 3.9 |
Group companies | tons | - | - | - | - | 0.4 | |
Total | tons | - | - | - | - | 4.3 | |
SOx*2 | non-consolidated | tons | 1.0 | 0.7 | 0.9 | 0.8 | 0.42 |
Group companies | tons | - | - | - | - | 0.01 | |
Total | tons | - | - | - | - | 0.43 | |
Particulate matter*3 | non-consolidated | tons | 0.5 | 0.5 | 0.4 | 0.2 | 0.3 |
Group companies | tons | - | - | - | - | 6.4 | |
Total | tons | - | - | - | - | 6.7 |
Indicators | Covering | Unit | 2020 | 2021 | 2022 | 2023 | 2024 |
---|---|---|---|---|---|---|---|
COD | consolidated | tons | 218.8 | 223.6 | 243 | 274 | 261 |
Total phosphorus | consolidated | tons | 3.2 | 11.2 | 7.1 | 18.5 | 1.69 |
Total nitrogen | consolidated | tons | 83.2 | 73.5 | 114.0 | 68.5 | 89.4 |
SS* | consolidated | tons | 48.4 | 49.9 | 49.2 | 44.6 | 54.7 |
Indicators | Covering | Unit | 2020 | 2021 | 2022 | 2023 | 2024 | |
---|---|---|---|---|---|---|---|---|
Amount of water taken | Waterworks | consolidated | thousand m3 | 763 | 805 | 755 | 566 | 1,022 |
Surface water (industrial water) | consolidated | thousand m3 | 7,874 | 8,098 | 7,952 | 7,863 | 8,425 | |
Groundwater (well water) | consolidated | thousand m3 | 1,918 | 1,946 | 1,836 | 1,847 | 1,593 | |
Others (reservoirs, rainwater storage) | consolidated | thousand m3 | 200 | 343 | 265 | 205 | 120 | |
Total*1 | consolidated | thousand m3 | 10,755 | 11,192 | 10,808 | 10,481 | 11,160 | |
From water-stressed regions*2 | consolidated | thousand m3 | 23 | 33 | 29 | 28 | 103 | |
Amount of water discharged*3 | Sea areas | consolidated | thousand m3 | 7,014 | 7,142 | 6,726 | 6,966 | 7,905 |
Rivers | consolidated | thousand m3 | 2,400 | 2,410 | 2,351 | 2,443 | 2,195 | |
Sewers | consolidated | thousand m3 | 974 | 987 | 910 | 1,045 | 1,287 | |
Total*1 | consolidated | thousand m3 | 10,388 | 10,539 | 9,987 | 10,454 | 11,386 | |
Amount of water recycled | consolidated | thousand m3 | 0 | 0 | 0 | 0 | 0 | |
Recycling rates | consolidated | % | 0 | 0 | 0 | 0 | 0 |
Indicators | Covering | Unit | 2020 | 2021 | 2022 | 2023 | 2024 | |
---|---|---|---|---|---|---|---|---|
Amount of water taken | Waterworks | non-consolidated | thousand m3 | 390 | 381 | 377 | 320 | 499 |
Surface water (industrial water) | non-consolidated | thousand m3 | 7,874 | 8,098 | 7,953 | 7,863 | 8,425 | |
Groundwater (well water) | non-consolidated | thousand m3 | 1,828 | 1,848 | 1,769 | 1,804 | 1,554 | |
Others (reservoirs, rainwater storage) | non-consolidated | thousand m3 | 0 | 0 | 17 | 28 | 30 | |
Total*1 | non-consolidated | thousand m3 | 10,092 | 10,327 | 10,116 | 10,015 | 10,508 | |
From water-stressed regions*2 | non-consolidated | thousand m3 | 0 | 0 | 0 | 0 | 0 | |
Amount of water discharged*3 | Sea areas | non-consolidated | thousand m3 | 7,014 | 7,142 | 6,726 | 6,966 | 7,905 |
Rivers | non-consolidated | thousand m3 | 2,395 | 2,408 | 2,350 | 2,441 | 2,192 | |
Sewers | non-consolidated | thousand m3 | 511 | 460 | 531 | 679 | 710 | |
Total*1 | non-consolidated | thousand m3 | 9,919 | 10,011 | 9,607 | 10,086 | 10,807 | |
Amount of water recycled | non-consolidated | thousand m3 | 0 | 0 | 0 | 0 | 0 | |
Recycling rates | non-consolidated | % | 0 | 0 | 0 | 0 | 0 |
Region or Country Name | Unit | Water amounts used at each water stress | |||||
---|---|---|---|---|---|---|---|
High | Medium-high | Medium | Low-medium | Low | |||
Asia | Japan | thousand m3 (Number of bases) | 0 | 1,600(2) | 17(3) | 8,891(5) | 0 |
China | thousand m3 (Number of bases) | 18(1) | 477(3) | 0 | 0 | 0 | |
Malaysia | thousand m3 (Number of bases) | 0 | 0 | 0 | 0 | 48(1) | |
Europe | Czech Republic | thousand m3 (Number of bases) | 0 | 20(1) | 0 | 0 | 0 |
Netherlands | thousand m3 (Number of bases) | 0 | 0 | 0 | 0 | 3(1) | |
UK | thousand m3 (Number of bases) | 1(1) | 0 | 0 | 0 | 0 | |
North and Central America | America | thousand m3 (Number of bases) | 75(1) | 0 | 0 | 1(1) | 0 |
Mexico | thousand m3 (Number of bases) | 9(1) | 0 | 0 | 0 | 0 | |
Total*2 | thousand m3 (Number of bases) | 103(4) | 2,097(6) | 17(3) | 8,891(6) | 52(2) |
Breakdown | Covering | Unit | 2020 | 2021 | 2022 | 2023 | 2024 | |||||||
---|---|---|---|---|---|---|---|---|---|---|---|---|---|---|
Invested amount | Costs | Invested amount | Costs | Invested amount | Costs | Invested amount | Costs | Invested amount | Costs | |||||
Inside business areas | Environmental pollution prevention | Air pollution prevention | non-consolidated | million yen | 20.9 | 97 | 37.1 | 124.2 | 68.1 | 141.9 | 40.5 | 103.4 | 210.4 | 93.1 |
Water pollution prevention | non-consolidated | million yen | 109.7 | 174.8 | 266.9 | 178.9 | 206.7 | 186 | 0 | 186.3 | 90.2 | 165 | ||
Underseepage prevention | non-consolidated | million yen | 5.5 | 3.7 | 4.9 | 5.6 | 7.2 | 5.1 | 5 | 8.3 | 3 | 9.2 | ||
Prevention of noise pollution and vibrations | non-consolidated | million yen | 17.2 | 6.2 | 6 | 0 | 6 | 0 | 16.1 | 0.1 | 0 | 0.1 | ||
Others | non-consolidated | million yen | - | 435 | - | 394.7 | - | 7 | - | 6.4 | 0 | 6.2 | ||
Global environmental conservation | non-consolidated | million yen | 172.6 | 100.4 | 244.6 | 92.3 | 236.6 | 63.5 | 425.6 | 87.7 | 320.7 | 123.8 | ||
Resource recycling | non-consolidated | million yen | 106.6 | 709.8 | 111.2 | 772.2 | 5.1 | 805.9 | 2.9 | 578.6 | 0 | 789.1 | ||
Upstream and downstream | Commissioning of container and package recycling | non-consolidated | million yen | - | 0.4 | - | 0.3 | - | 0.3 | - | 0.4 | - | 0.3 | |
Sewage treatment expenses | non-consolidated | million yen | - | 78.7 | - | 75.2 | - | 66.9 | - | 80 | - | 83.4 | ||
Management activities | System preparation and operation | non-consolidated | million yen | - | 105.3 | - | 174.9 | - | 93.3 | - | 85.9 | - | 60.9 | |
Enviromental burden monitoring | non-consolidated | million yen | - | 42.5 | - | 38.3 | - | 38.4 | - | 39.9 | - | 31 | ||
Information disclosure | non-consolidated | million yen | - | 6.3 | - | 6.3 | - | 6.3 | - | 6.3 | - | 6.3 | ||
Education, training and others | non-consolidated | million yen | - | 59.4 | - | 59.3 | - | 59.6 | - | 60.2 | - | 3.1 | ||
Greening up (tree planting, etc.) | non-consolidated | million yen | - | 70 | 0.5 | 43.9 | 0 | 70 | 0 | 59.4 | 1 | 74.8 | ||
R&D | non-consolidated | million yen | - | 57.2 | - | 39.2 | - | 158.3 | - | 85.5 | - | 147.4 | ||
Community activities | non-consolidated | million yen | - | 8.9 | - | 9 | - | 9.8 | - | 9.8 | - | 10.1 | ||
Environmental damage | non-consolidated | million yen | - | 0 | - | 0 | - | 0 | - | 0 | - | 0 | ||
Total* | non-consolidated | million yen | 432.5 | 1,955.5 | 670.8 | 2,014.5 | 529.7 | 2,054 | 490.2 | 1,751.4 | 624.3 | 1,604 |
Items for which we seek to derive benefits | Main economic benefit details | Covering | Unit | 2020 | 2021 | 2022 | 2023 | 2024 | |
---|---|---|---|---|---|---|---|---|---|
Inside business area benefits | Environmental pollution prevention benefits | Air pollution prevention | non-consolidated | million yen | 0 | 0 | 0 | 0 | 0 |
Water pollution prevention | non-consolidated | million yen | 0 | 0 | 3.5 | 0 | 0 | ||
Reduction of contamination load charges | non-consolidated | million yen | 0.4 | 0.6 | 0.4 | 0.3 | 0.1 | ||
Prevention of noise pollution and vibrations | non-consolidated | million yen | 0 | 0 | 0 | 0 | 0 | ||
Climate change mitigation measures | Climate change mitigation measures | non-consolidated | million yen | 112.8 | 80.4 | 97.4 | 109.3 | 107.7 | |
Waste and recycling | Waste reduction | non-consolidated | million yen | 9.5 | 4.1 | 2.6 | 2.2 | 1.1 | |
Outside sales of renewable resources | non-consolidated | million yen | 10.5 | 17.3 | 25.9 | 38.2 | 8.8 | ||
Others | non-consolidated | million yen | 0 | 7 | 40.9 | 49.7 | 87.8 | ||
Upstream and downstream benefits | Container recycling | non-consolidated | million yen | 73.6 | 54.2 | 38.3 | 38.8 | 46.8 | |
Others | non-consolidated | million yen | 0 | 0 | 0 | 0 | 0 | ||
Total* | non-consolidated | million yen | 206.8 | 167.1 | 205.5 | 238.5 | 252.3 |
Breakdown | Covering | Unit | 2020 | 2021 | 2022 | 2023 | 2024 |
---|---|---|---|---|---|---|---|
Air pollution prevention equipment | non-consolidated | million yen | 20.9 | 37.1 | 68.1 | 40.5 | 210.4 |
Water pollution prevention equipment | non-consolidated | million yen | 109.7 | 266.9 | 206.7 | 304.5 | 90.2 |
Underseepage prevention equipment | non-consolidated | million yen | 5.5 | 4.9 | 7.2 | 5 | 3 |
Equipment to prevent noise pollution and vibrations | non-consolidated | million yen | 17.2 | 6 | 6 | 16.1 | 0 |
Industrial waste processing equipment | non-consolidated | million yen | 106.6 | 111.2 | 5.1 | 2.9 | 0 |
Greening up plants (through tree-planting, etc.) | non-consolidated | million yen | 1.8 | 0.5 | 3.3 | 0 | 1 |
Energy saving; Global warming prevention | non-consolidated | million yen | 172.6 | 244.6 | 236.6 | 425.6 | 320.7 |
Total* | non-consolidated | million yen | 434.3 | 671.3 | 533 | 794.7 | 625.3 |
Breakdown | Covering | Unit | 2020 | 2021 | 2022 | 2023 | 2024 |
---|---|---|---|---|---|---|---|
Measures against equipment deterioration | non-consolidated | million yen | 292.9 | 490.9 | 245 | 454.9 | 750.6 |
Safety and work environment measures | non-consolidated | million yen | 171.4 | 171.4 | 86.6 | 281.6 | 108.5 |
Measures against fires caused by explosion and leaks | non-consolidated | million yen | 9.2 | 14.1 | 60.6 | 54.4 | 16.8 |
Measures regarding natural disasters such as earthquakes | non-consolidated | million yen | 51.4 | 4.4 | 6.5 | 65.2 | 282.2 |
Others | non-consolidated | million yen | 4.5 | 6.4 | 32 | 0 | 0 |
Total* | non-consolidated | million yen | 529.4 | 687.1 | 430.7 | 856.1 | 1158.1 |
Area | Certification secured | Certifying Institution | Certification Number |
---|---|---|---|
Himeji Plant | March 1999 | JIA-QA | JE0054H |
Joetsu Plant (including the distribution center) | August 2002 | SGS | JP15/071413 |
Fukuyama Plant | April 1999 | JCQA | JCQA-E-0062 |
Asa Plant | September 1998 | JCQA | JCQA-E-0987 |
Tokyo Plant | December 1998 | JCQA | JCQA-E-0036 |
Takasaki Plant | January 2000 | JCQA | JCQA-E-0101 |
Kashima Plant | March 1999 | JCQA | JCQA-E-0046 |
Kayaku Safety Systems Europe | December 2002 | BVCZ | 250302-2017-AE-CZS-RvA |
Kayaku Safety Systems (Huzhou) | June 2016 | SNQA | 42144 |
Kayaku Safety Systems de Mexico | June 2023 | LRQA | 00041092 |
Kayaku Safety Systems Malaysia | April 2017 | SGS | MY17/02395 |
WUXI POLATECHNO OPTICS | April 2006 | UCC | 02420E31011518R2M |
KAYAKU CHEMICAL (WUXI) | August 2006 | UCC | 02421E32060755R0M |
WUXI ADVANCED KAYAKU CHEMICALS | July 2007 | CQC | 00121E33375R4M/3200 |
Cover rate* | 70% |
Indicators | Covering | Unit | 2020 | 2021 | 2022 | 2023 | 2024 |
---|---|---|---|---|---|---|---|
Number of violations of environmental laws and regulations | consolidated | cases | 0 | 0 | 0 | 0 | 0 |
Number of environmental accidents | consolidated | cases | 0 | 0 | 0 | 0 | 0 |
Violations of laws and regulations; fines issued for enrivonmental accidents; punishment costs | consolidated | yen | 0 | 0 | 0 | 0 | 0 |
Indicators | Category | Covering | Unit | 2020 | 2021 | 2022 | 2023 | 2024 |
---|---|---|---|---|---|---|---|---|
Regular employees | Male | consolidated | persons | - | - | 3,883 | 3,991 | 3,992 |
Female | consolidated | persons | - | - | 1,797 | 1,832 | 1,850 | |
Neither / Don't know | consolidated | persons | - | - | - | 2 | 0 | |
Total | consolidated | persons | - | - | 5,680 | 5,825 | 5,842 | |
Female rate | consolidated | % | - | - | 31.6 | 31.5 | 31.7 | |
Male | non-consolidated | persons | 1,751 | 1,754 | 1,748 | 1,770 | 1,774 | |
Female | non-consolidated | persons | 326 | 330 | 333 | 343 | 352 | |
Neither / Don't know | non-consolidated | persons | - | - | - | 0 | 0 | |
Total | non-consolidated | persons | 2,077 | 2,084 | 2,081 | 2,113 | 2,126 | |
Female rate | non-consolidated | % | 15.6 | 15.8 | 16.0 | 16.2 | 16.6 | |
Contracted/ part-time employees* | Male | consolidated | persons | - | - | - | 444 | 398 |
Female | consolidated | persons | - | - | - | 246 | 252 | |
Neither / Don't know | consolidated | persons | - | - | - | 0 | 0 | |
Total | consolidated | persons | - | - | 726 | 690 | 651 | |
Male | non-consolidated | persons | - | 412 | 419 | 382 | 334 | |
Female | non-consolidated | persons | - | 194 | 194 | 182 | 190 | |
Neither / Don't know | non-consolidated | persons | - | 0 | 0 | 0 | 0 | |
Total | non-consolidated | persons | 614 | 606 | 613 | 564 | 524 | |
Temp staff | Male | consolidated | persons | - | - | 89 | 90 | 102 |
Female | consolidated | persons | - | - | 132 | 103 | 112 | |
Neither / Don't know | consolidated | persons | - | - | - | 0 | 0 | |
Total | consolidated | persons | - | - | 221 | 193 | 214 | |
Male | non-consolidated | persons | 5 | 19 | 24 | 26 | 30 | |
Female | non-consolidated | persons | 14 | 28 | 44 | 37 | 33 | |
Neither / Don't know | non-consolidated | persons | - | - | - | 0 | 0 | |
Total | non-consolidated | persons | 19 | 47 | 68 | 63 | 63 |
Indicators | Category | Covering | Unit | 2020 | 2021 | 2022 | 2023 | 2024 |
---|---|---|---|---|---|---|---|---|
Below Section Chief | Male | consolidated | persons | - | - | - | - | 660 |
Female | consolidated | persons | - | - | - | - | 136 | |
Total | consolidated | persons | - | - | - | - | 792 | |
Female rate | consolidated | % | - | - | - | - | 17.2 | |
Below Section Chief | Male | non-consolidated | persons | 359 | 321 | 412 | 418 | 414 |
Female | non-consolidated | persons | 24 | 38 | 42 | 43 | 40 | |
Total | non-consolidated | persons | 383 | 359 | 454 | 461 | 454 | |
Female rate | non-consolidated | % | 6.2 | 10.5 | 9.3 | 10.3 | 8.8 | |
Section Chief and above | Male | consolidated | persons | - | - | - | - | 175 |
Female | consolidated | persons | - | - | - | - | 31 | |
Total | consolidated | persons | - | - | - | - | 203 | |
Female rate | consolidated | % | - | - | - | - | 15.3 | |
Section Chief and above | Male | non-consolidated | persons | 74 | 68 | 66 | 62 | 62 |
Female | non-consolidated | persons | 4 | 4 | 5 | 3 | 3 | |
Total | non-consolidated | persons | 78 | 72 | 71 | 65 | 65 | |
Female rate | non-consolidated | % | 5.1 | 5.5 | 7 | 4.6 | 4.6 | |
Overall | Male | consolidated | persons | - | - | - | - | 830 |
Female | consolidated | persons | - | - | - | - | 171 | |
Total | consolidated | persons | - | - | - | - | 995 | |
Female rate | consolidated | % | - | - | - | - | 17.2 | |
Overall | Male | non-consolidated | persons | 468 | 476 | 478 | 480 | 476 |
Female | non-consolidated | persons | 44 | 47 | 47 | 46 | 43 | |
Total | non-consolidated | persons | 512 | 523 | 525 | 526 | 519 | |
Female rate | non-consolidated | % | 8.6 | 9 | 9 | 8.8 | 8.3 |
Indicators | Category | Covering | Unit | 2020 | 2021 | 2022 | 2023 | 2024 |
---|---|---|---|---|---|---|---|---|
Age groups | Under 18 | consolidated | persons | - | - | - | - | 0 |
18-19 | consolidated | persons | - | - | - | - | 37 | |
20-29 | consolidated | persons | - | - | - | - | 873 | |
30-39 | consolidated | persons | - | - | - | - | 1,612 | |
40-49 | consolidated | persons | - | - | - | - | 1,703 | |
50-59 | consolidated | persons | - | - | - | - | 1,201 | |
Over 60 | consolidated | persons | - | - | - | - | 162 | |
Average age | Male | consolidated | age | - | - | - | - | 40.4 |
Female | consolidated | age | - | - | - | - | 40.9 | |
Overall | consolidated | age | - | - | - | - | 40.5 | |
Age groups | Under 18 | non-consolidated | persons | - | - | - | - | 0 |
18-19 | non-consolidated | persons | - | - | - | - | 18 | |
20-29 | non-consolidated | persons | 394 | 376 | 362 | 359 | 353 | |
30-39 | non-consolidated | persons | 579 | 575 | 578 | 610 | 617 | |
40-49 | non-consolidated | persons | 576 | 585 | 589 | 559 | 554 | |
50-59 | non-consolidated | persons | 523 | 547 | 498 | 580 | 579 | |
Over 60 | non-consolidated | persons | 5 | 1 | 1 | 5 | 5 | |
Average age | Male | consolidated | age | - | - | - | - | 40.4 |
Female | consolidated | age | - | - | - | - | 40.9 | |
Overall | consolidated | age | - | - | - | - | 40.5 | |
Average age | Male | non-consolidated | age | 39.8 | 40.2 | 40.4 | 40.6 | 40.6 |
Female | non-consolidated | age | 42.6 | 42.8 | 42.9 | 42.9 | 42.6 | |
Overall | non-consolidated | age | 40.3 | 40.6 | 40.8 | 41 | 41 |
Indicators | Covering | Unit | 2020 | 2021 | 2022 | 2023 | 2024 |
---|---|---|---|---|---|---|---|
Disabled employees | consolidated | persons | - | - | 92 | 68 | 82 |
Disabled employment rate*1 | consolidated | % | - | - | 1.44 | 1.04 | 1.26 |
Disabled employment rate*2 | non-consolidated | % | 2.01 | 2.00 | 1.98 | 1.93 | 2.11 |
(Statutory employment rate) | non-consolidated | % | 2.2 | 2.3 | 2.3 | 2.3 | 2.5 |
Indicators | Category | Covering | Unit | 2020 | 2021 | 2022 | 2023 | 2024 |
---|---|---|---|---|---|---|---|---|
Average number of years of continuous service | Male | consolidated | years | - | - | - | - | 12.2 |
Female | consolidated | years | - | - | - | - | 11 | |
Overall | consolidated | years | - | - | - | - | 11.8 | |
Average number of years of continuous service | Male | non-consolidated | years | 14.2 | 14.5 | 14.4 | 14.9 | 14.9 |
Female | non-consolidated | years | 16.5 | 16.6 | 16.6 | 16.4 | 15.4 | |
Overall | non-consolidated | years | 14.6 | 14.9 | 15.1 | 15.1 | 15 |
Indicators | Covering | Unit | 2020 | 2021 | 2022 | 2023 | 2024 |
---|---|---|---|---|---|---|---|
Regular employees leaving the company for personal reasons | consolidated | persons | - | - | 535 | 282 | 331 |
Rate of regular employees leaving the company for personal reasons | consolidated | % | - | - | 9.4 | 4.8 | 5.7 |
Regular employees leaving the company for personal reasons | non-consolidated | persons | 41 | 48 | 50 | 51 | 61 |
Turnover rate | non-consolidated | % | 2.2 | 2.3 | 2.3 | 2.9 | 2.8 |
Rate of employees leaving the company for personal reasons | non-consolidated | % | 1.8 | 2.1 | 2.4 | 2.4 | 2.9 |
Employees leaving the company within 3 years of joining* | non-consolidated | persons | 7 | 7 | 4 | 5 | 6 |
Rate of employees leaving the company within 3 years of joining | non-consolidated | % | 4 | 4 | 2 | 3 | 3.5 |
Indicators | Covering | Unit | 2020 | 2021 | 2022 | 2023 | 2024 |
---|---|---|---|---|---|---|---|
Transfers | non-consolidated | persons | 1 | 2 | 3 | 3 | 7 |
Indicators | Covering | Unit | 2020 | 2021 | 2022 | 2023 | 2024 |
---|---|---|---|---|---|---|---|
Average number of annual hours worked per worker | consolidated | hours | - | - | - | - | 1,916 |
Average monthly overtime hours | consolidated | hours | - | - | - | - | 10.7 |
Average number of annual hours worked per worker | non-consolidated | hours | 1,885 | 1,911 | 1,896 | 1,876 | 1,883 |
Average monthly overtime hours | non-consolidated | hours | 11.3 | 12.7 | 11.9 | 11.2 | 11.8 |
Indicators | Covering | Unit | 2020 | 2021 | 2022 | 2023 | 2024 |
---|---|---|---|---|---|---|---|
Average number of days of annual paid leave taken | consolidated | days | 12.2 | 11.1 | 12 | 13.3 | 22.4 |
Annual Paid Leave take-up rate | consolidated | % | 65.8 | 59.8 | 63.7 | 72.8 | 85.7 |
Average number of days of annual paid leave taken | non-consolidated | days | 12.2 | 11.1 | 12 | 13.3 | 13.4 |
Annual Paid Leave take-up rate | non-consolidated | % | 65.8 | 59.8 | 63.7 | 72.8 | 73 |
Indicators | Covering | Unit | 2020 | 2021 | 2022 | 2023 | 2024 | |
---|---|---|---|---|---|---|---|---|
Commencement of Maternity Leave*1 | non-consolidated | persons | 13 | 11 | 22 | 21 | 14 | |
Commencement of Childcare Leave*1 | Male | non-consolidated | persons | 11 | 9 | 62 | 50 | 56 |
Female | non-consolidated | persons | 13 | 11 | 22 | 16 | 19 | |
Childcare Leave System take-up rate*2 | Male | non-consolidated | % | 31.4 | 27.2 | 69.6 | 78.5 | 100 |
Female | non-consolidated | % | 100 | 100 | 100 | 100 | 100 | |
Post-childbirth and post-Childcare Leave return-to-work rate | Male | non-consolidated | % | 100 | 100 | 100 | 100 | 100 |
Female | non-consolidated | % | 100 | 100 | 100 | 100 | 100 | |
Post-childbirth and post-Childcare Leave retention rate | Male | non-consolidated | % | 100 | 100 | 100 | 100 | 100 |
Female | non-consolidated | % | 100 | 100 | 100 | 100 | 100 | |
Reduced Working Hours for Childcare take-up rate | Male | non-consolidated | persons | 0 | 1 | 2 | 3 | 3 |
Female | non-consolidated | persons | 43 | 42 | 48 | 52 | 56 |
Indicators | Covering | Unit | 2020 | 2021 | 2022 | 2023 | 2024 |
---|---|---|---|---|---|---|---|
Employees taking Nursing Care Leave | non-consolidated | persons | 0 | 0 | 0 | 1 | 0 |
Nursing Care Leave System users | non-consolidated | persons | 1 | 0 | 2 | 3 | 2 |
Indicators | Covering | Unit | 2020 | 2021 | 2022 | 2023 | 2024 | |
---|---|---|---|---|---|---|---|---|
Average annual pay | Male | non-consolidated | 1,000 yen | 7,423 | 7,683 | 8,003 | 7,704 | 7,979 |
Female | non-consolidated | 1,000 yen | 6,133 | 6,366 | 6,707 | 6,336 | 6,632 | |
Overall | non-consolidated | 1,000 yen | 7,224 | 7,477 | 7,801 | 7,488 | 7,763 | |
Gender wage differentials* | Full-time workers | non-consolidated | % | - | - | 75.6 | 82.2 | 83.1 |
Part-time & fixed-term workers | non-consolidated | % | - | - | 53.0 | 70.9 | 71.2 | |
All workers | non-consolidated | % | - | - | 72.3 | 71.4 | 72.5 |
Indicators | Covering | Unit | 2020 | 2021 | 2022 | 2023 | 2024 |
---|---|---|---|---|---|---|---|
Number of union members*1 | consolidated | persons | - | - | - | - | 3,532 |
Union membership rate*2 | consolidated | % | - | - | - | - | 72 |
Number of union members*1 | non-consolidated*3 | persons | 1,753 | 1,695 | 1,687 | 1,697 | 1,697 |
Union membership rate*2 | non-consolidated*3 | % | 100 | 100 | 100 | 100 | 100 |
Indicators | Covering | Unit | 2020 | 2021 | 2022 | 2023 | 2024 |
---|---|---|---|---|---|---|---|
Response rate | non-consolidated | % | - | - | - | 85.9 | 83.9 |
Employee engagement | non-consolidated | score | - | - | - | 47.1 | 48.4 |
Indicators | Covering | Unit | 2020 | 2021 | 2022 | 2023 | 2024 |
---|---|---|---|---|---|---|---|
Number of labor standard violations | consolidated | cases | - | - | 1 | 0 | 1 |
Number of labor standard violations | non-consolidated | cases | - | - | 1 | 0 | 1 |
Indicators | Category | Covering | Unit | 2020 | 2021 | 2022 | 2023 | 2024 |
---|---|---|---|---|---|---|---|---|
New employees (graduates)*1 | Male | consolidated | persons | - | - | - | - | 119 |
Female | consolidated | persons | - | - | - | - | 53 | |
Total | consolidated | persons | - | - | - | - | 171 | |
Female rate | consolidated | % | - | - | - | - | 31 | |
New employees (graduates)*1 | Male | non-consolidated | persons | 49 | 41 | 37 | 45 | 43 |
Female | non-consolidated | persons | 8 | 7 | 6 | 13 | 15 | |
Total | non-consolidated | persons | 57 | 48 | 43 | 58 | 58 | |
Female rate | non-consolidated | % | 14 | 14.5 | 14 | 22.4 | 25.9 | |
New employees (mid-career)*2 | Male | consolidated | persons | - | - | - | - | 174 |
Female | consolidated | persons | - | - | - | - | 150 | |
Total | consolidated | persons | - | - | - | - | 324 | |
Female rate | consolidated | % | - | - | - | - | 46.3 | |
New employees (mid-career)*2 | Male | non-consolidated | persons | 28 | 32 | 45 | 44 | 45 |
Female | non-consolidated | persons | 6 | 7 | 10 | 15 | 19 | |
Total | non-consolidated | persons | 34 | 39 | 55 | 59 | 64 | |
Female rate | non-consolidated | % | 17.6 | 17.9 | 18.2 | 25.4 | 29.7 |
Indicators | Covering | Unit | 2020 | 2021 | 2022 | 2023 | 2024 |
---|---|---|---|---|---|---|---|
Employment of retired employees | non-consolidated | persons | 42 | 22 | 29 | 30 | 33 |
Employment rate of retired employees | non-consolidated | % | 95.4 | 84.6 | 85.2 | 85.7 | 68.75 |
Indicators | Covering | Unit | 2020 | 2021 | 2022 | 2023 | 2024 |
---|---|---|---|---|---|---|---|
Training hours per regular employee | non-consolidated | hours | 14 | 13 | 15 | 17.7 | 15 |
Total training hours | non-consolidated | hours | 29,156 | 27,092 | 31,045 | 37,465 | 31,915 |
Amount invested in education and training per employee | non-consolidated | yen | 35,706 | 66,606 | 83,002 | 76,565 | 72,015 |
Business Site | Certification secured | Certifying Institution | Certification Number |
---|---|---|---|
Kayaku Safety Systems (Huzhou) | January 2023 | NQA | 132021 |
Cover rate* | 5% |
Indicators | Covering | Unit | 2020 | 2021 | 2022 | 2023 | 2024 | |
---|---|---|---|---|---|---|---|---|
Number of work-related accidents resulting in death and other serious accidents | non-consolidated | cases | 0 | 0 | 0 | 0 | 0 | |
Number of work-related employee deaths | Regular employees | consolidated | persons | 0 | 1 | 0 | 0 | 0 |
Contracted employees / part-time employees | consolidated | persons | 0 | 0 | 0 | 0 | 0 | |
Partner company employees*1 | consolidated | persons | 0 | 0 | 0 | 0 | 0 | |
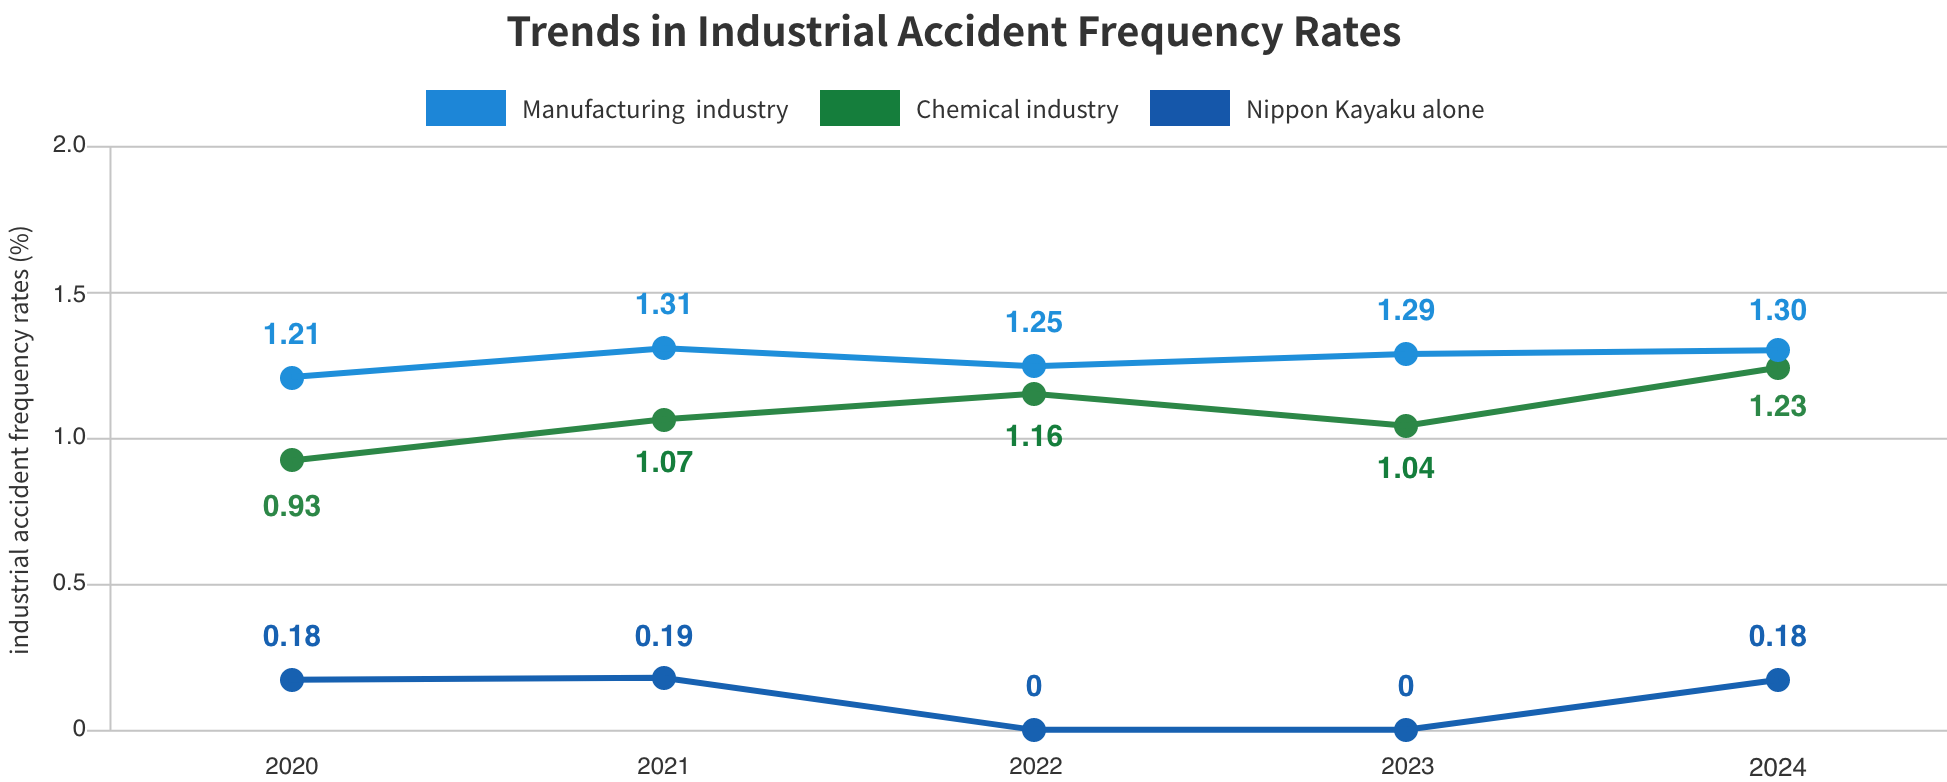
Rate of Lost Time Injuries | Regular employees | non-consolidated | *2 | 0.18 (1cases) |
0.19 (1cases) |
0 (0cases) |
0 (0cases) |
0 (0cases) |
Contracted employees / part-time employees | non-consolidated | *2 | 0 | 0 | 0 | 0 | 1.12 | |
Partner company employees*1 | non-consolidated | *2 | 0 | 0 | 0 | 0 | 2.12 | |
Employees | Group companies | *2 | - | - | - | 1.5 (9people) |
1.89 (12people) |
|
Lost Time Injury Intensity Rate | non-consolidated | *3 | 0 | 0 | 0 | 0 | 0.0004 | |
Number of violations of Occupational Safety and Health-related regulations and standards | non-consolidated | cases | 0 | 0 | 0 | 0 | 0 |
Indicators | Covering | Unit | 2020 | 2021 | 2022 | 2023 | 2024 |
---|---|---|---|---|---|---|---|
New Hire Training* | non-consolidated | persons | 49 | 41 | 46 | 60 | 72 |
New Manager Training* | non-consolidated | persons | 24 | 54 | 57 | 42 | 29 |
Indicators | Covering | Unit | 2020 | 2021 | 2022 | 2023 | 2024 |
---|---|---|---|---|---|---|---|
Regular health check take-up rate* | non-consolidated | % | 100 | 100 | 100 | 100 | 100 |
Stress-check take-up rate* | non-consolidated | % | 97.2 | 98.1 | 97.9 | 98 | 96.6 |
Proportion of "highly-stressed" persons | non-consolidated | % | 9.5 | 10.6 | 10 | 10.1 | 10.1 |
Mental health-related investments | non-consolidated | million yen | 11 | 13 | 12.6 | 12.6 | 10.8 |
Training type | Main contents | Mainly aimed at | FY | Training format | No. of times | Average take-up rate |
---|---|---|---|---|---|---|
Sustainability training | ・Nippon Kayaku Group's Revised Human Rights Policy, human rights initiatives demanded of companies | Executives, employees, (including contracted and part-time employees), temp staff | 2024 | E-learning | 1 | 86% |
Business Site Name | ISO9001 | ISO13485 | IATF16949 | ISO22000 |
---|---|---|---|---|
Safety Head Plant (Himeji) | ● | |||
Safety Systems Group | ||||
Research & Development Head Office | ||||
Polatechno Group | ● | |||
Joetsu Plant | ||||
WUXI POLATECHNO OPTICS | ||||
Fukuyama Plant | ● | |||
Asa Plant | ||||
Tokyo Plant | ||||
Fine Chemicals Business Unit | ||||
Fine Chemicals Research Lab | ||||
Taiwan Nippon Kayaku (Fine Chemicals Business Unit) | ||||
Takasaki Plant | ● | ● | ||
Pharmaceuticals Group | ||||
Pharmaceuticals Research Laboratories | ||||
Kashima Plant | ● | |||
Agrochemicals Group | ||||
Agrochemicals Laboratories | ||||
Kayaku Safety Systems Europe | ● | |||
Kayaku Safety Systems (Huzhou) | ● | |||
Kayaku Safety Systems de Mexico | ● | |||
Kayaku Safety Systems Malaysia | ● | |||
MOXTEK | ● | |||
Dejima Optical Films | ● | |||
RaySpec | ● | |||
KAYAKU CHEMICAL (WUXI) | ● | |||
Kayaku Advanced Materials | ● | ● | ||
WUXI ADVANCED KAYAKU CHEMICALS | ● | |||
NIPPONKAYAKU FOOD TECHNO | ● | ● |
Business Site Name | Principal certifying countries |
---|---|
Takasaki Plant | Japan, America, Europe |
Training Type | Contents | Attendees in FY2024 | Total |
---|---|---|---|
Why? Why? Analysis Training | ・Root cause analysis at the time of a problem ・Drafting reoccurrence prevention measures ・Practical exercises |
47 (33 males, 14 females) | 263 (Since FY2020) |
Measures Against Human Error Training | ・Extracting human error risks ・Drafting advance prevention measures ・Horizontal expansion of prevention activities |
166 (144 males, 22 females) | 910 (Since FY2020) |
Quality Training for New Hires | ・The relationship between Quality the KAYAKU spirit ・"Quality Control for Everyone"; 7 tools for Quality Control ・ISO standards and accreditation |
58 (43 males, 15 females) | 317 (Since FY2021) |
Monthly Quality Lecture | Seminar on Quality Defect Prevention "The Conversation Technique for Accelerating Team Growth: Unravelling the psychological mechanism behind quality defects and understanding the essence of quality compliance" |
143 (92 males, 51 females) | 303 (Since FY2023) |
Indicators | Covering | Unit | 2020 | 2021 | 2022 | 2023 | 2024 |
---|---|---|---|---|---|---|---|
R&D costs | consolidated | billion yen | 12.4 | 13 | 13.3 | 19.8 | 15 |
R&D costs as a percentage of sales | consolidated | % | 7.2 | 7 | 6.7 | 9.8 | 6.7 |
Indicators | Covering | Unit | 2020 | 2021 | 2022 | 2023 | 2024 |
---|---|---|---|---|---|---|---|
CSR expenditure | non-consolidated | million yen | 146 | 154 | 149 | 158 | 93 |
Total donations | non-consolidated | million yen | 114 | 123 | 120 | 126 | 90 |
Other CSR expenditures | non-consolidated | million yen | 32 | 31 | 29 | 32 | 3 |
Indicators | Covering | Unit | 2020 | 2021 | 2022 | 2023 | 2024 | |
---|---|---|---|---|---|---|---|---|
Directors | Inside | Male | persons | 7 | 6 | 6 | 6 | 6 |
Female | persons | 0 | 0 | 0 | 0 | 0 | ||
Total | persons | 7 | 6 | 6 | 6 | 6 | ||
Outside (Independent) | Male | persons | 3 (3) | 3 (3) | 3 (3) | 3 (3) | 3 (3) | |
Female | persons | 0 | 0 | 0 | 1 (1) | 1 (1) | ||
Total | persons | 3 (3) | 3 (3) | 3 (3) | 4 (4) | 4 (4) | ||
Overall Total (Independent) | persons | 10 (3) | 9 (3) | 9 (3) | 10 (4) | 10 (4) | ||
Average term | years | 2.7 | 3 | 4 | 4.6 | 3.5 | ||
Independent Outside Director Percentage (Results) | % | 30 | 33 | 33 | 40 | 40 | ||
Female Director Percentage | % | 0 | 0 | 0 | 10 | 10 | ||
Executive Directors | persons | 7 | 6 | 6 | 6 | 6 |
Indicators | Covering | Unit | 2020 | 2021 | 2022 | 2023 | 2024 | |
---|---|---|---|---|---|---|---|---|
Auditors | Inside | Male | persons | 2 | 1 | 1 | 1 | 1 |
Female | persons | 0 | 1 | 1 | 1 | 1 | ||
Total | persons | 2 | 2 | 2 | 2 | 2 | ||
Outside (Independent) | Male | persons | 3 (2) | 3 (2) | 3 (3) | 3 (3) | 3 (3) | |
Female | persons | 0 | 0 | 0 | 0 | 0 | ||
Total | persons | 3 (2) | 3 (2) | 3 (3) | 3 (3) | 3 (3) | ||
Overall Total (Independent) | persons | 5 (2) | 5 (2) | 5 (3) | 5 (3) | 5 (3) | ||
Average term | years | 2.8 | 3 | 4 | 4.4 | 1.2 | ||
Independent Outside Auditor Percentage (Results) | % | 40 | 40 | 60 | 60 | 60 | ||
Female Auditor Percentage | % | 0 | 20 | 20 | 20 | 20 |
Meeting Frequency | Meetings Held | |||||
---|---|---|---|---|---|---|
2020 | 2021 | 2022 | 2023 | 2024 | ||
Board of Directors | Monthly | 14 | 14 | 14 | 14 | 14 |
Nominations & Remuneration Advisory Committee | Whenever necessary | 3 | 5 | 6 | 6 | 7 |
Sustainable Management Meeting | Weekly | 51 | 48 | 50 | 48 | 47 |
Executive Directors Meeting | Quarterly | 4 | 4 | 4 | 4 | 4 |
Management Strategy Meeting | Twice a year | 2 | 2 | 2 | 2 | 2 |
Audit & Supervisory Board | Monthly | 12 | 12 | 12 | 12 | 12 |
Ethics Committee | Twice a year | 2 | 2 | 2 | 2 | 2 |
Risk Management Committee | Twice a year | 2 | 2 | 2 | 4 | 2 |
Environment, Safety and Quality Management Committee | Twice a year | 2 | 2 | 2 | 2 | 2 |
Research & Development Management Committee | Twice a year plus convened ad hoc by the chairman when required | 1 | 3 | 2 | 2 | 2 |
Executive Title | Name | Board Meeting attendance | Nominations & Remuneration Advisory Committee attendance |
---|---|---|---|
President and Representative Director | Atsuhiro Wakumoto | 14/14 | 7/7 |
Representative Director | Yoshitsugu Ishida | 14/14 | - |
Member of the Board | Shigeyuki Kawamura | 14/14 | - |
Member of the Board | Hiroshi Shimada | 11/11 | - |
Member of the Board | Shinji Inoue | 11/11 | - |
Member of the Board | Makoto Takeda | 11/11 | 7/7 |
Outside Director (Independent) | Yo Ota | 14/14 | 5/7 |
Outside Director (Independent) | Yasuyuki Fujishima | 13/14 | 6/7 |
Outside Director (Independent) | Seiichi Fusamura | 13/14 | 6/7 |
Outside Director (Independent) | Ikuko Akamatsu | 14/14 | 4/7 |
Average rate of attendance | 98.6% | 83.3% |
Position | Name | Board Meetings attended | Auditor attendance |
---|---|---|---|
Standing Auditor | Megumi Machida | 14/14 | 12/12 |
Standing Auditor | Yoichiro Wada | 14/14 | 12/12 |
Outside Auditor (Independent) | Ichiro Wakasa | 14/14 | 12/12 |
Outside Auditor (Independent) | Atsushi Iwasaki | 11/11 | 10/10 |
Outside Auditor (Independent) | Kyoichi Toriyama | 10/11 | 10/10 |
Average rate of attendance | 98.2% | 100% |
Category | Unit | 2020 | 2021 | 2022 | 2023 | 2024 | |
---|---|---|---|---|---|---|---|
Directors | Total remuneration amount | million yen | 449 | 410 | 382 | 349 | 419 |
(Outside Directors excepted) | Number of directors concerned | persons | 7 | 8 | 6 | 8 | 9 |
Auditors | Total remuneration amount | million yen | 44 | 45 | 45 | 45 | 46 |
(Outside Directors excepted) | Number of directors concerned | persons | 2 | 3 | 2 | 3 | 2 |
Outside Directors | Total remuneration amount | million yen | 47 | 55 | 57 | 71 | 75 |
Number of directors concerned | persons | 6 | 6 | 7 | 7 | 9 | |
Total | million yen | 540 | 510 | 484 | 465 | 540 |
Indicators | Unit | 2020 | 2021 | 2022 | 2023 | 2024 |
---|---|---|---|---|---|---|
Remuneration based on audit and certification work | million yen | 89 | 80 | 73 | 79 | 86 |
Remuneration not based on audit work | million yen | 0 | 0 | 0 | 0 | 0 |
Total | million yen | 89 | 80 | 73 | 79 | 86 |
Category | Number of shares | Number of voting shares | Details |
---|---|---|---|
Non-voting shares | - | - | - |
Restricted voting shares (treasury stocks etc.) | - | - | - |
Restricted voting shares (other) | - | - | - |
Full voting shares (treasury stocks etc.) | (treasury stocks) Common shares 5,111,400 |
- | - |
(Mutually-held shares) Common shares 28,000 |
- | - | |
Full voting shares (other) | Common shares 159,609,400 | 1,596,094 | - |
Shares of less than one unit* | Common shares 254,770 | - | - |
Total number of shares issued | 165,003,570 | - | - |
General shareholder voting shares | - | 1,596,094 | - |
Contents of Complaints and Consultations | Covering | Unit | 2020 | 2021 | 2022 | 2023 | 2024 |
---|---|---|---|---|---|---|---|
Harrassment (power harrassment, sexual harrassment, etc.) | non-consolidated | cases | 6 | 2 | 7 | 16 | 8 |
Group companies | cases | - | - | - | - | 5 | |
Violations of company rules or manners | non-consolidated | cases | 0 | 0 | 2 | 3 | 6 |
Group companies | cases | - | - | - | - | 3 | |
Work or labor-related | non-consolidated | cases | 1 | 1 | 3 | 5 | 3 |
Group companies | cases | - | - | - | - | 0 | |
Others | non-consolidated | cases | 0 | 1 | 4 | 3 | 0 |
Group companies | cases | - | - | - | - | 0 | |
Total | non-consolidated | cases | 7 | 4 | 16 | 27 | 25 |
Whistleblowing | Covering | Unit | 2020 | 2021 | 2022 | 2023 | 2024 |
---|---|---|---|---|---|---|---|
Whistleblowing complaints and consultations from suppliers | non-consolidated | cases | - | 0 | 1 | 0 | 4 |
Indicators | Covering | Unit | 2020 | 2021 | 2022 | 2023 | 2024 |
---|---|---|---|---|---|---|---|
Number of violations of anti-corruption-related policies | non-consolidated | cases | 0 | 0 | 0 | 0 | 0 |
Employee punishments and dismissals | non-consolidated | cases | 0 | 0 | 0 | 0 | 0 |
Corruption-related fines issued | non-consolidated | yen | 0 | 0 | 0 | 0 | 0 |
Applications of corruption-related penalties | non-consolidated | cases | 0 | 0 | 0 | 0 | 0 |
Indicators | Covering | Unit | 2020 | 2021 | 2022 | 2023 | 2024 |
---|---|---|---|---|---|---|---|
Political donations | non-consolidated | 10,000 yen | 113 | 104 | 106 | 89 | 89 |
Scroll sideways for an overview of the table below.
Indicators | Covering | Unit | 2020 | 2021 | 2022 | 2023 | 2024 |
---|---|---|---|---|---|---|---|
Number of Critical Security Incident cases* | consolidated | cases | - | - | - | 0 | 0 |
Business Site | Certification secured | Registered for inspection with | Certification Number |
---|---|---|---|
Kayaku Safety Systems Europe | January 2023 | DNV | SW215F |
Kayaku Safety Systems de Mexico | January 2023 | TUV NORD DE MEXICO | S6485M |
Kayaku Safety Systems Malaysia | May 2024 | ENX ASSOCIATION | S5LX79 |